Overview
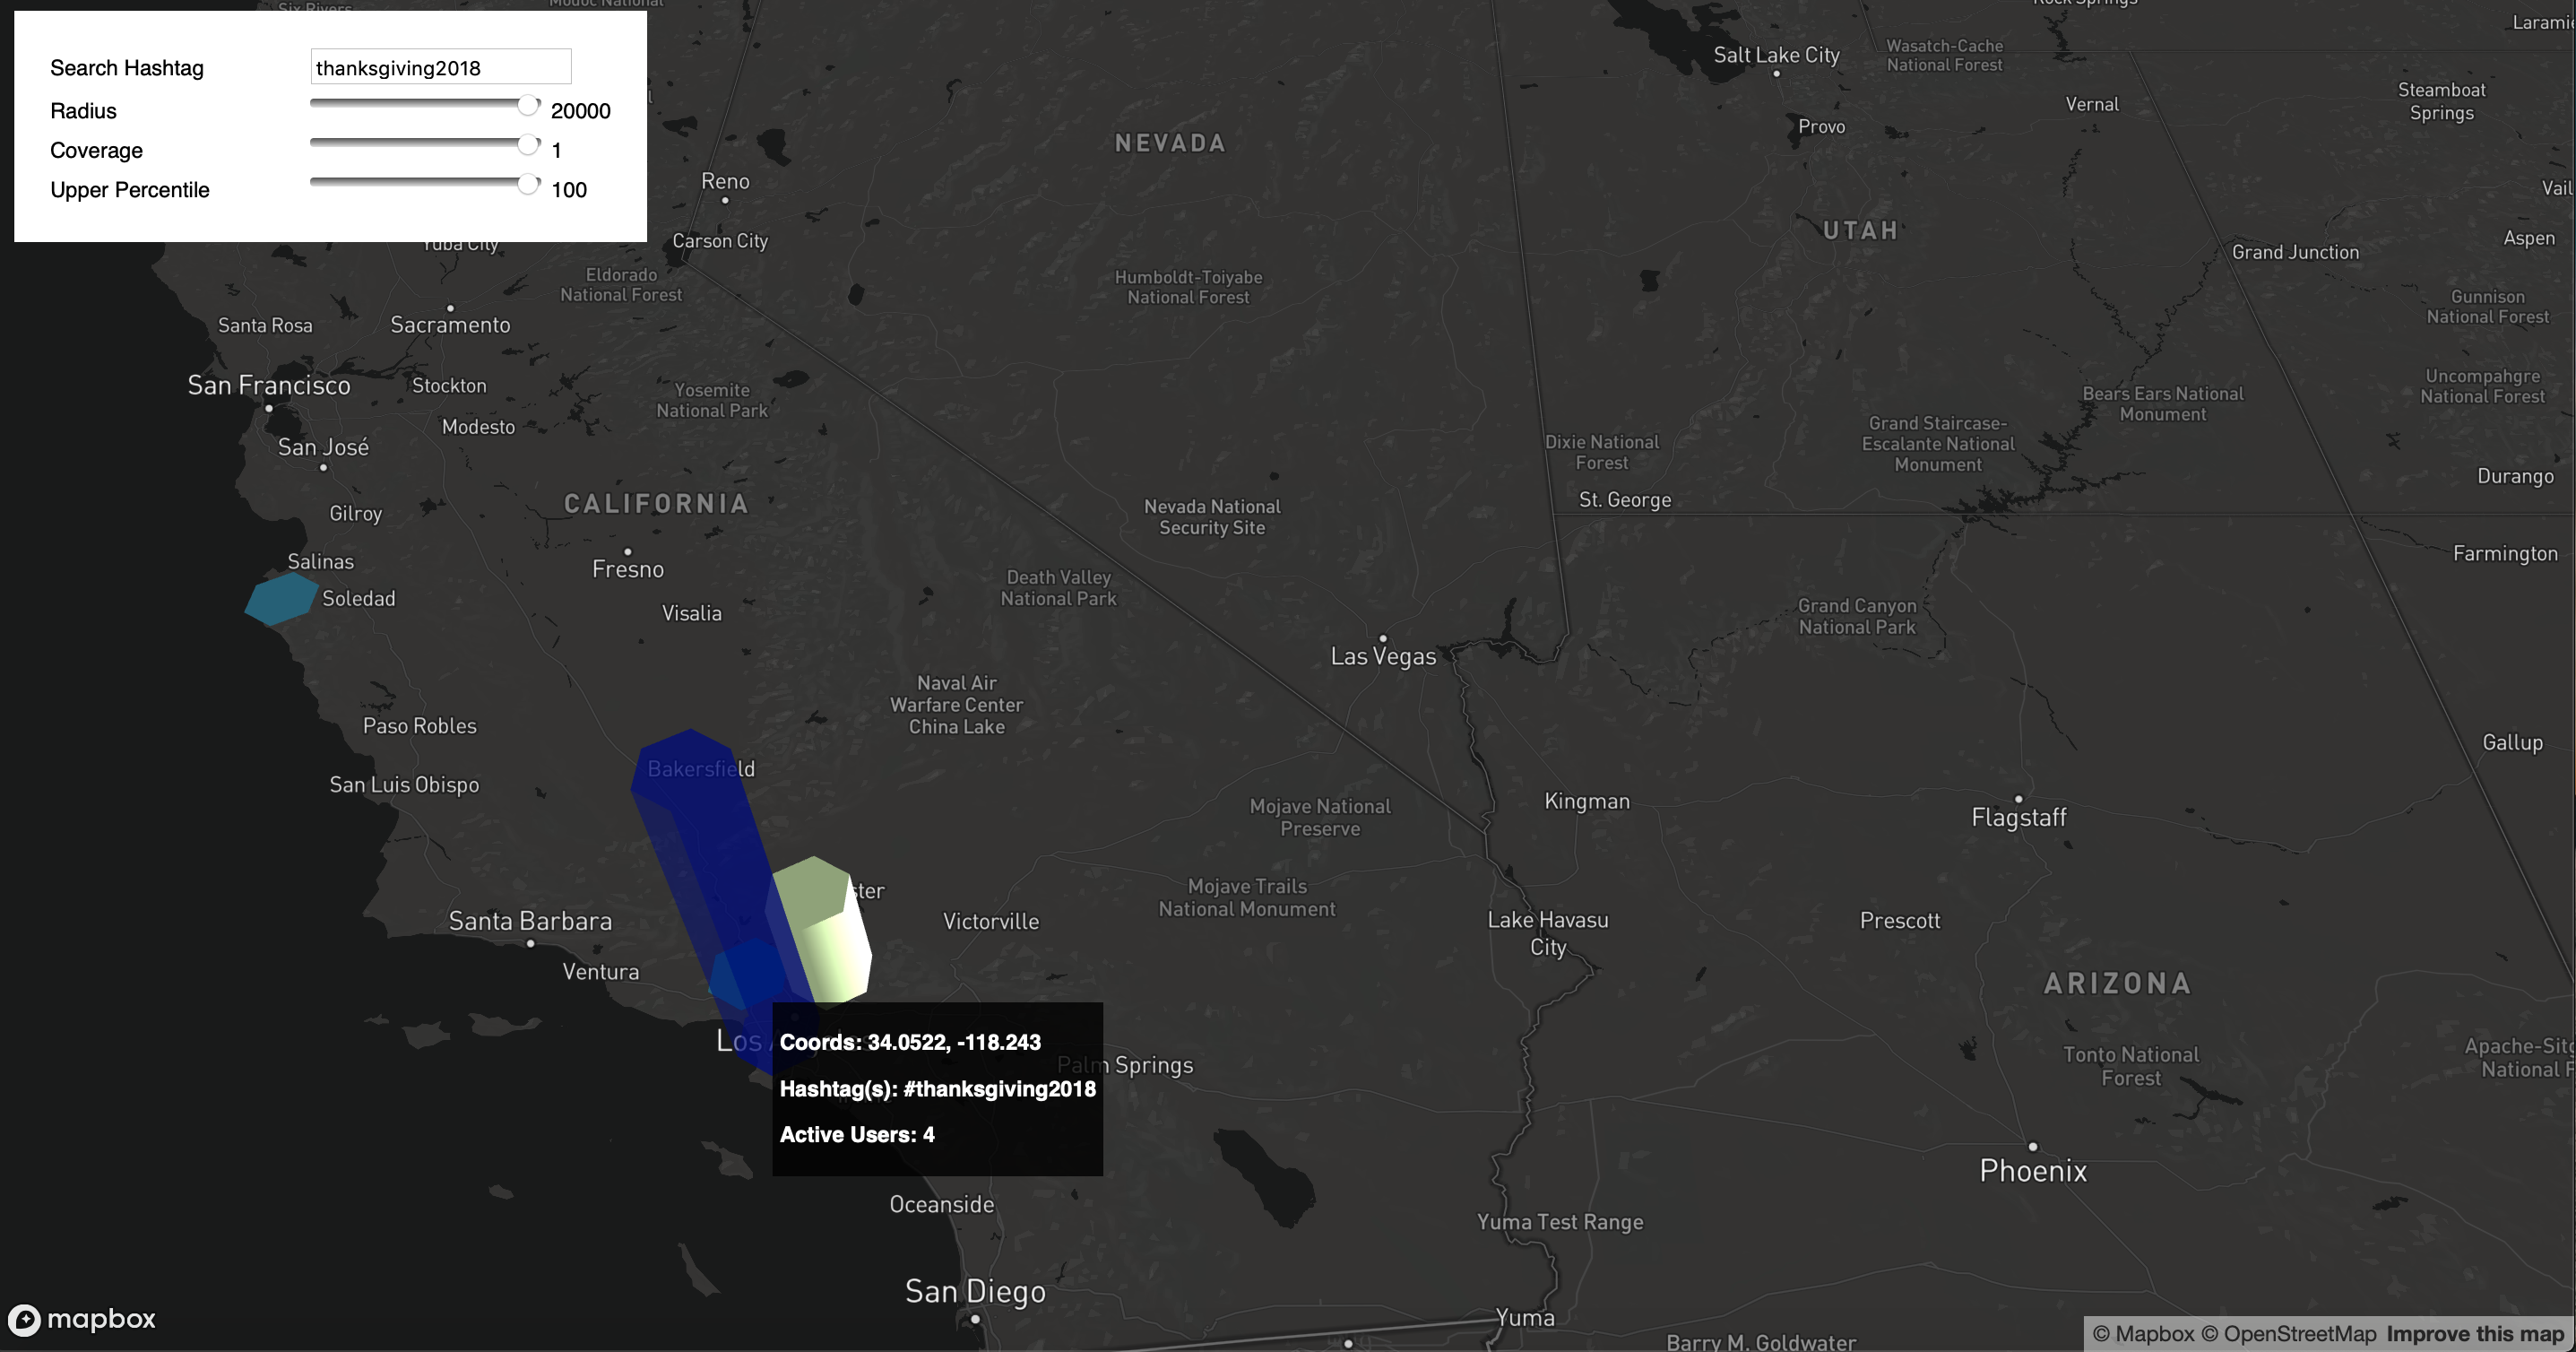
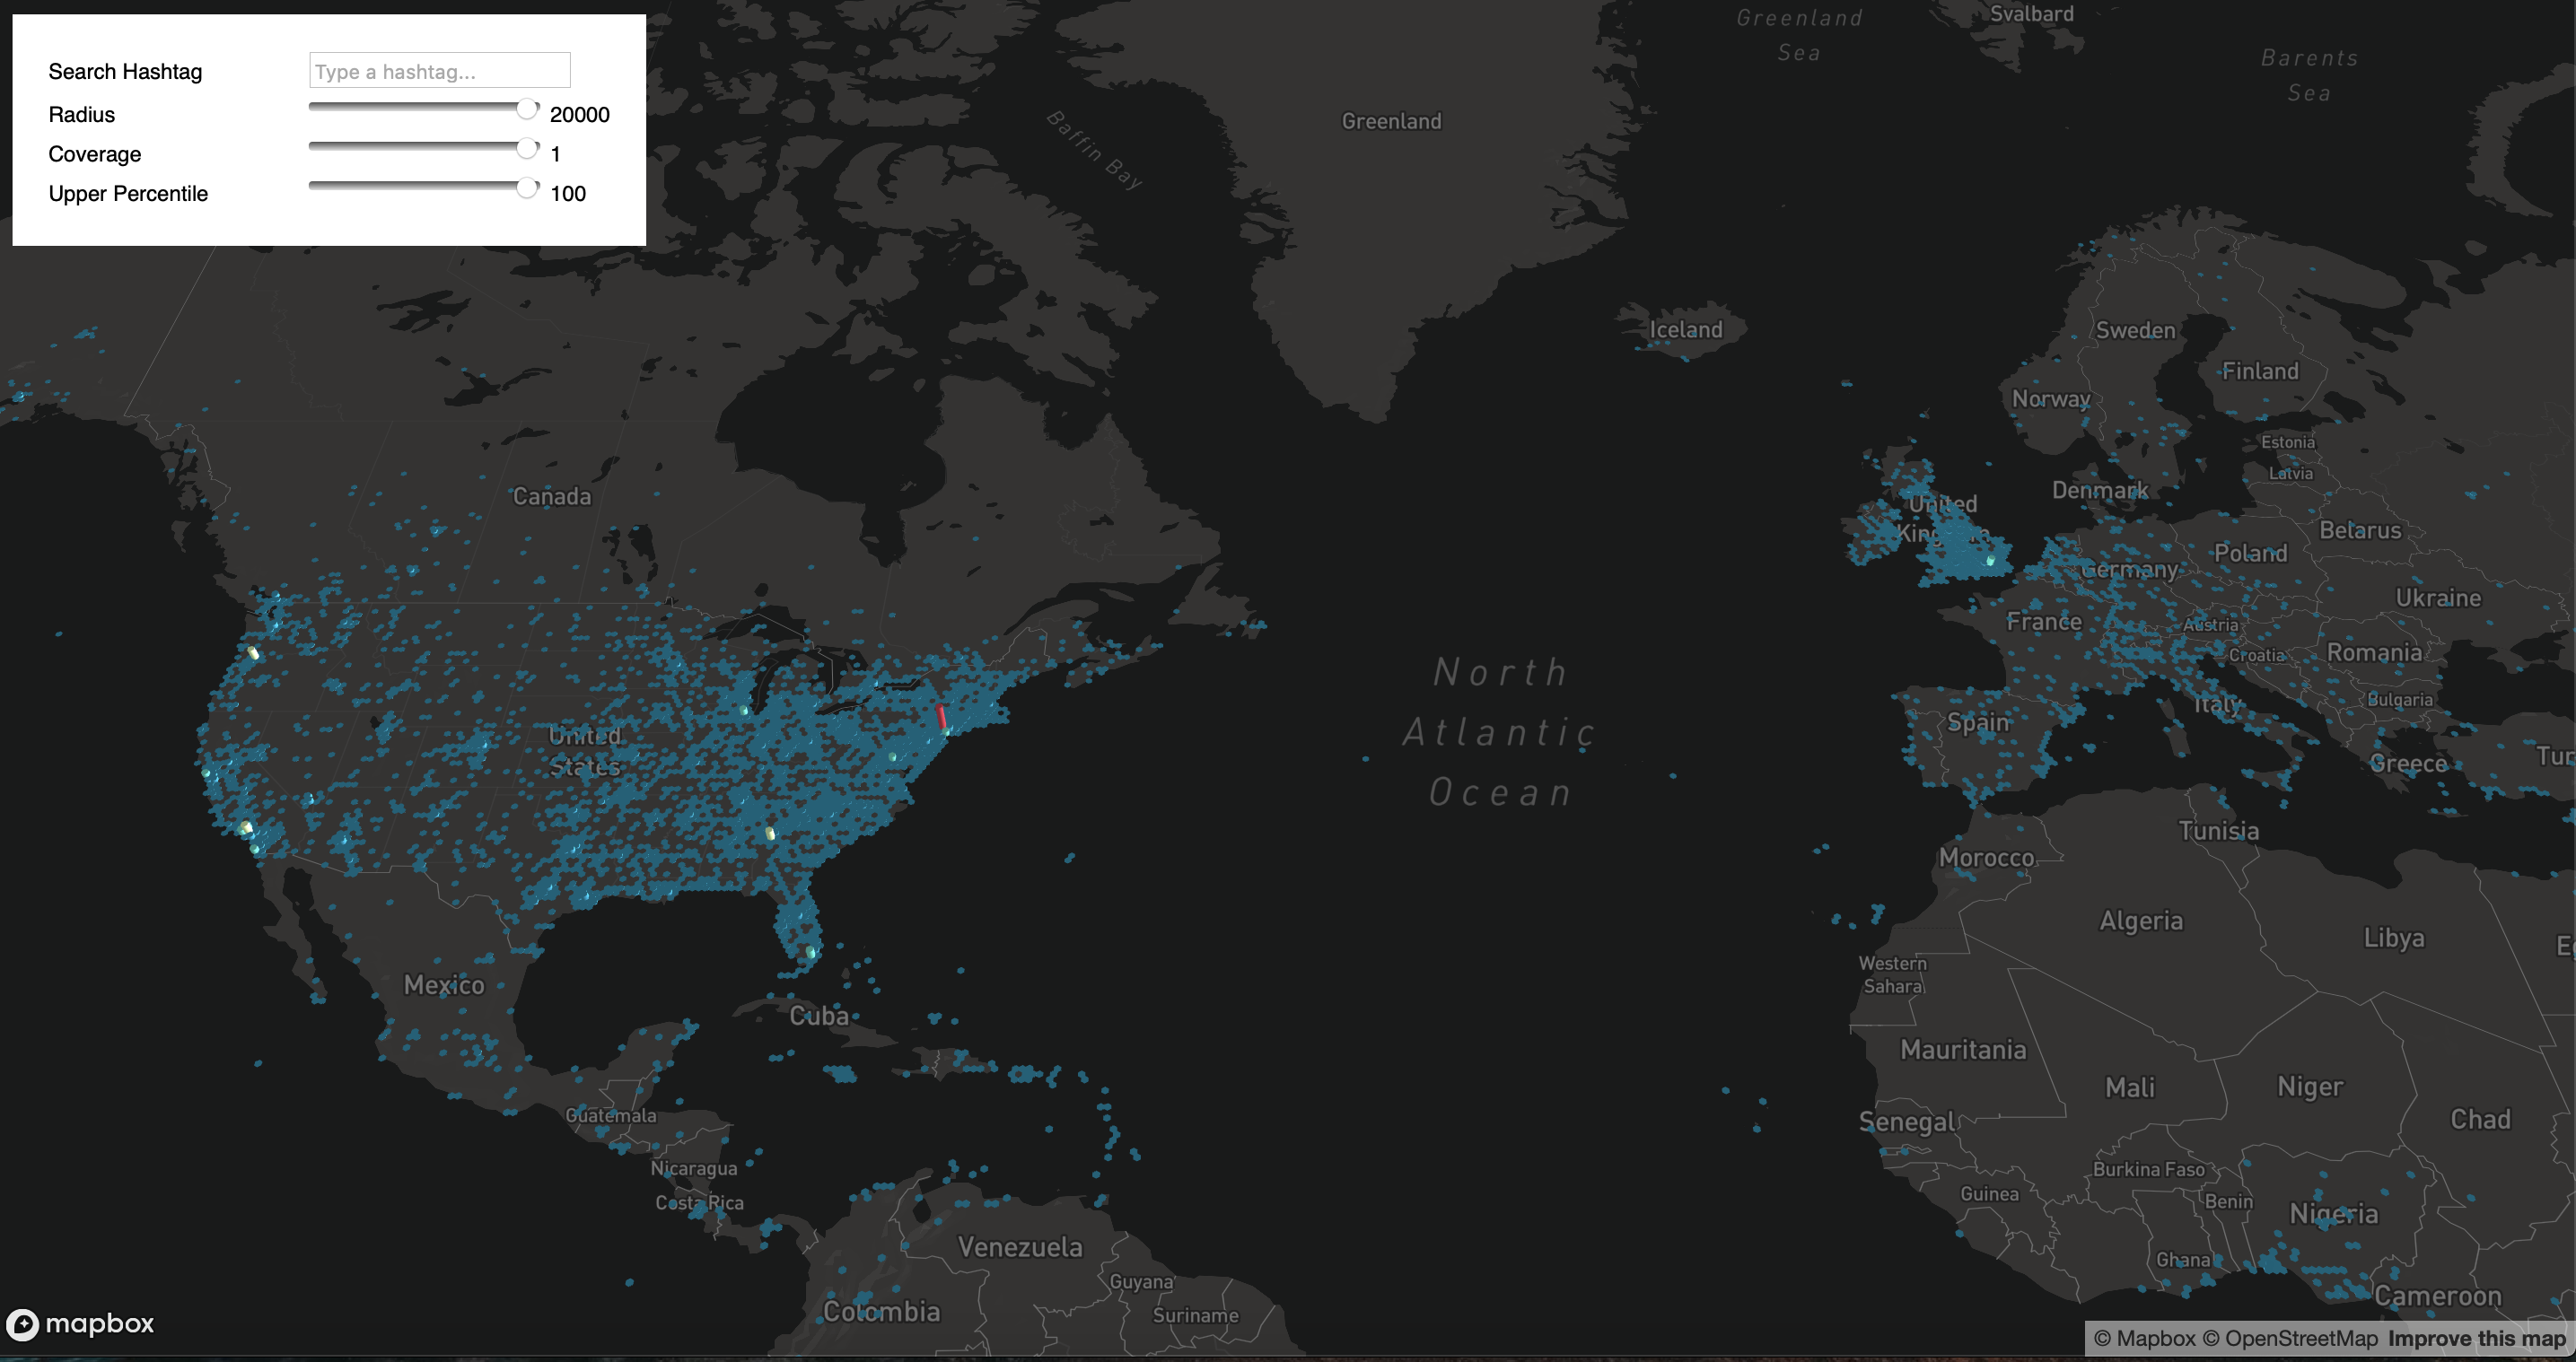
Twitter being one of the largest social networking platform, generates a high volume and high velocity of data every second. This big data can be used for statistical analysis and visual representation, which enables users to understand various data behavioral patterns and their representation in real-time. The objective of this project is to create a visual representation of twitter data using Hive and data visualization tool by live-streaming twitter data. Furthermore, the location coordinates of the tweet would be mapped onto the world map alongside its hashtag. To streamline the process of finding the top hashtag, a hashtag search bar can be implemented which would allow the user to view only relevant hashtags that the user searched for.
Project Description
A tweet is a form of unstructured data that can comprise of plain texts, URL, usernames and hashtags. Hashtag is generally used to convey the gist of the entire tweet in a single
word prefixed with the symbol “#”. Twitter groups similar tweets together which can be indexed by the hashtag. For e.g., if a user wants to search for all the tweets associated to politics,
that can be done by using “#politics” in the search functionality.
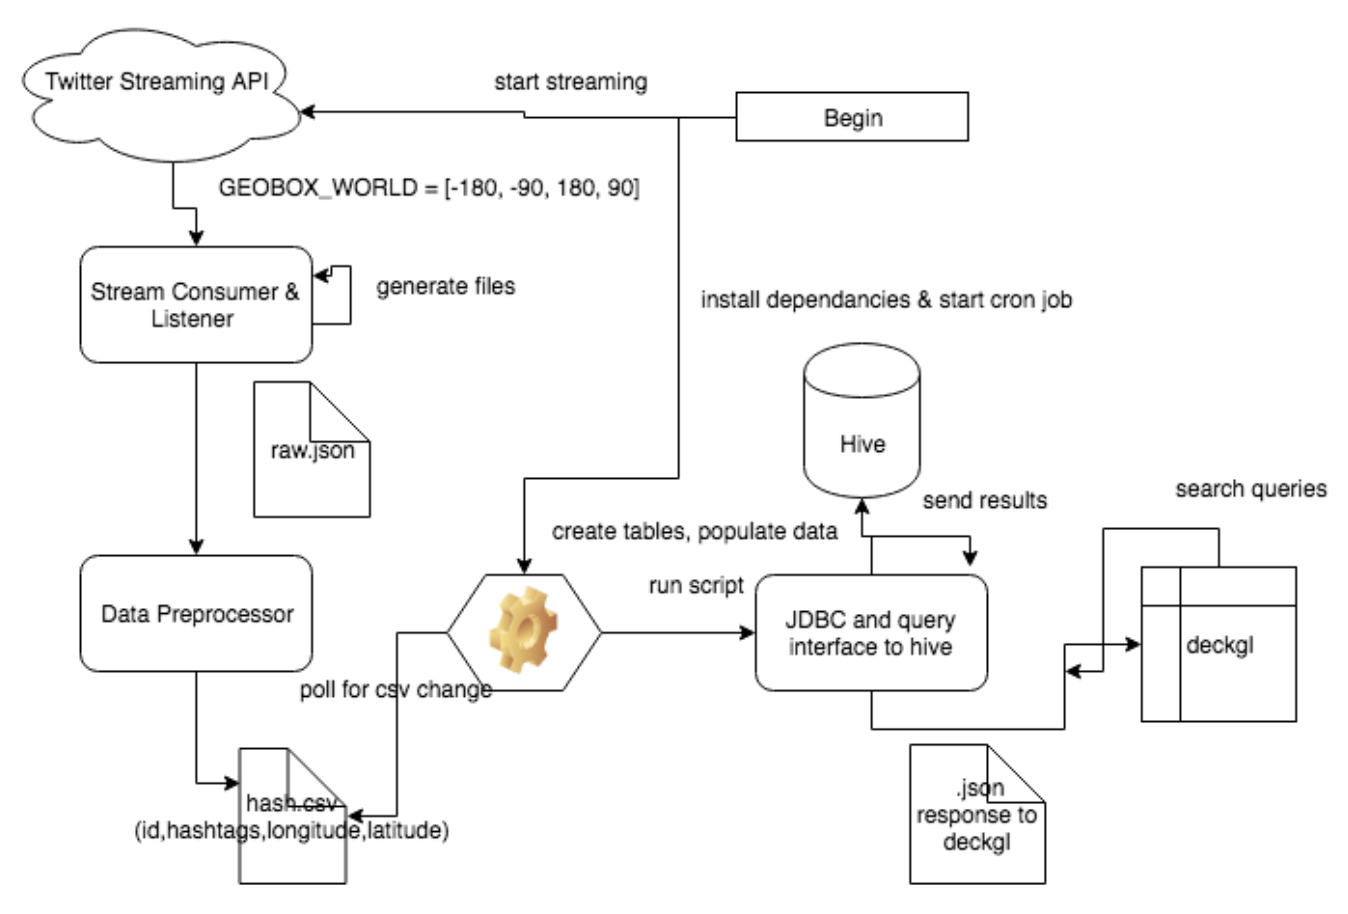
For the proposed solution, we aimed to use the Twitter API to collect live twitter stream data in JSON format. There are two forms of data; static and dynamic, that are both feasible to be used
however, static dataset will not contain the real-time information and the current trends on Twitter at the current instance. In comparison, data analysis can be done on live-stream of data using the dynamic approach.
For storing and retrieval of data, Hive is an effective tool that allows the user to get particular tweets based on the specified query. Apache Hive is a data warehouse software
project built on top of Apache Hadoop for providing data query and analysis. Hive gives an SQL-like interface to query data stored in various databases and file systems that integrate
with Hadoop. For querying the data, Hive table can be made to extract the relevant information and visualize the data as per user request. For calculating the number of hashtags, we can
extract the id and hashtag text and store it in the form of ordered collection of elements. The search bar functionality is essentially a search query in the Hive table that would retrieve
the information and update the visualization on the world map.
The data can be visualized using one of the following data visualization technology/tools:
- Deck GL (WebGL2-powered, highly performant large-scale data visualization)
- Mapbox (Geo-visualization platform)
- CARTO (Dynamic Geospatial data visualization and analysis)
- D3.js (JavaScript library that offers powerful data visualization features)
System Architecture
Gallery